
Security orchestration, automation and response (SOAR) solutions combine incident response, orchestration and automation, and threat intelligence (TI) management capabilities in a single platform. SOAR tools are also used to document and implement processes (aka playbooks, workflows and processes); support security incident management; and apply machine-based assistance to human security analysts and operators. SOAR solutions must provide: – Highly customizable workflow process management that enables repeatable automated tasks to be turned into playbooks that run in isolation or joined together into more sophisticated workflows. – The ability to store (locally or in a third-party system) incident management data to support SecOps investigations. – Manually instigated and automated triggers that augment human security analyst operators to carry out operational tasks consistently. – A mechanism to collate and better operationalize the use of threat intelligence. – Support for a broad range of existing security technologies that supports improved analyst efficiency and acts as an abstraction layer between the desired outcomes and the custom-made set of solutions in place in your environment.
Category: Cybersecurity
Tenable
Tenable.io enables you to analyze data from multiple sensors — Nessus scanners and agents, as well as passive listening.
With a “software as a service” approach, Tenable handles the administration of the Tenable.io platform, so your focus remains on reducing risk in your organization. Your security and audit teams can share sensors within Tenable.io. You can also share scan schedule, scan policies and scan results among an unlimited set of users or groups.
You will no longer have to relay purely on IP addresses that don’t accurately reflect dynamic assets like virtual machines, cloud instances, and multi-homed hosts.
The combination of asset and vulnerability tracking in Tenable.io means that vulnerabilities can be tracked from the time they are recognized through remediation.
A successful vulnerability management program accomplishes four goals: discovery, assessment, remediation, and validation. Gathering timely and accurate data is essential. You accomplish this through regularly scheduled credentialed scans, agent scans, and network traffic analysis.
Scanners and agents collect data to be reported by Tenable.io.
Scanners
By default, Tenable.io is configured with a regional, specific cloud scanner. In addition to using the default cloud scanner, users can also link Nessus scanners, NNM scanners, and Nessus Agents to Tenable.io.
Once linked to Tenable.io, use the Tenable.io key to add remote scanners to Scanner Groups. You can also manage and select remote scanners when configuring scans.
You must install a Nessus scanner or NNM instance on a host before you can link the scanner to Tenable.io.
The Linked Scanners page displays scanner names, types, and permissions.
Agents
Agents increase scan flexibility by making it easy to scan assets without needing ongoing host credentials or assets that are offline. Additionally, agents enable large-scale concurrent scanning with little network impact.
You must install a Nessus Agent on a host before you can link the agent to Tenable.io.
Deploy and Link Nessus Scanners
- Log in as an administrator and navigate to the “Scanners” Page by clicking on “Scans” and then “Scanners”.
- To define permissions for Tenable.io, first choose a scanner. Then, click on “Permissions”.
- If the default permissions are set to “No access”, no users can launch scans using this scanner.
- If set to “Can use”, every user with scanning permissions can launch scans with this scanner.
- If set to “Can manage”, standard users and administrators can also share the scanner.
- You may define permissions for specific users or groups by adding them manually, which is helpful if you need to restrict local scanner access to certain users only.
- It is common to user manually defined permissions in conjunction with the default permission “No access”.
- To begin adding scanners, navigate to the “Scanners” section. Here, you see a key that you can use to link additional Nessus scanners and Passive Vulnerability Scanners, plus an option to regenerate the key. Copy this key. You will need it during registration. Now, let’s configure an additional Nessus scanner.
- Once you have downloaded and installed Nessus, load the initial configuration page in a web browser. To access the configuration page, please visit: https://<hostname > : 8834
- Create an administrative username and password.
- Choose the registration option “link to Tenable.io” and paste in the key you obtained earlier.
- If a proxy is required, check “User Proxy” and enter the settings. When finished, click “Continue”.
- The scanner initializes and begins downloading plugins and any required software updates from Tenable.io. Once this is complete, you may log in with the username and password you created. You may manage user accounts, configure a proxy server, and access advanced settings.
- To begin using the new scanner, log into the Tenable.io interface. Go to the “Scanners” page. Here, you see the new scanner’s operational status and current scan count, along with options to disable or delete the scanner entirely.
- You cannot choose a disabled scanner when creating an launching a new scan. Disabling is useful during scanner system maintenance, as you do not need to reconfigure the scanner.
- Deleting the scanner removes it completely. You must reconfigure the scanner to reconnect it to Tenable.io.
- Click on the scanner to reveal details and information about the scanner.
- To update the scanner’s plugins, click the “Update Plugins” icon.
- When the scanner is actively scanning, this page also shows the currently running scan, when it last updated, the scan owner, and status. You can also pause or stop the scan.
- You can define permission for the scanner as you did for the built-in Tenable.io scanners, using the options “no access”, “can use”, and “can manage”.
- To configure scanner groups, navigate to the “Scanner Groups” section.
- Click the “New Group” button.
- Provide a descriptive name.
- After creating the group, add your desired scanners.
- In the “Manage Scans” section, you can see currently running scans and their owners, and pause or stop the scans.
- The “Settings” page is where you can rename the scanner group.
- In the “Permissions” section, you can define access to the scanner group, like for other Tenable.io components.
Deploy and Link Nessus Agents
Setting up Nessus Agents is a two-part process. You must first define the agent groups and permission in Tenable.io, and then configure the remote agents to connect to Tenable.io.
- To start configuring Nessus Agent integration
- log into Tenable.io as an administrative user.
- Navigate to your agents (Scans -> Agents)
- Make note of the key, as you will need it later when configuring the installed agents.
- To view instructions for configuring installed agents, click the link in the description.
- Next, create an agent group. Creating groups can help you organize agents for scanning purposes. Navigate to the “Agent Groups” section.
- Create a New Group. Provide a descriptive name that will be useful when creating scans.
- Next, define the permissions for the group.
- If default permissions are set to “No access”, no users will be allowed to launch agent-based scans against systems in this group.
- If set to “Can use”, users will be allowed to launch agent-based scans against this group, but will not be allowed to edit the group or any of its agents.
- You may also define permissions for individual users and groups. When finished, click the “Save” button.
- Now, you may begin deploying your remote Nessus Agents to connect to Tenable.io.
- To obtain the installation packages, log into the Tenable Support Portal: https://support.tenable.com
- Navigate to the “Downloads” area and click on “Nessus”. Choose the Nessus Agent that matches your operating system and architecture.
- Once downloaded, you can deploy the installer package using your software deployment platform, or copy it manually to the desired system.
- During a manual Windows installation, enter the key, IP address (cloud.tenable.com:443) and port, and the group in which to place the system. When complete, the Nessus Agent service starts and connects to Tenable.io. The service is configured to start automatically at system startup.
- If you are deploying the Nessus Agent to many machines at once, you can automate the process by passing configuration settings automatically during the install. For example, you could create a group policy object that automatically pushes out and installs a Nessus Agent using Microsoft’s MSI installer. The parameters to use for this process are as follows.
- msiexec.ext/q /l* agent_log.text /i NessusAgent64-6.10.0.msi NESSUS_SERVER=<IP or HOST>:8834 NESSUS_KEY=<key> NESSUS_GROUPS=<group1,group2>
- The “q” switch quiets the installation so the end-user does not see any dialogs. The “L” switch creates a log file during installation. The “I” switch installs the desired package.
- Next, you can specify the server and port, the key and the group in whch to place the system.
- This process can help you in quickly deploying agents to a large number of systems.
- The installed agent also has a command line tool you can use to configure the settings to the Agent, verify connectivity, and more.
- Open a command prompt and navigate to the directory where the agent is installed (c:\>cd “c:\Program Files\Tenable\Nessus Agent”).
- Run the ‘nessuscli.exe’ command to show all available options.
- The local agent commands allow you to configure the link settings, unlink the agent, and obtain the agent’s current status.
- Once the agent is installed, you can use the Tenable.io interface to configure additional agent related settings.
- For Unix-based systems, you can obtain the installation packages by logging into the Tenable Support Portal (https://support.tenable.com).
- Nagivate to the “Downloads” area and click on “Nessus”. Choose the Nessus Agent that matches your operating system and architecture.
- Once downloaded, you can deploy the installer package using your software deployment platform, or copy it manually to the desired system.
- rmp -ivh NessusAgent-6.4.0-es6.x86_64.rpm
- After installation, you can link this agent to Tenable.io by using the following command (/opt/nessus_agent/sbin/nessuscli agent) and specifying the IP, port, and key.
- /opt/nessus_agent/sbin/nessuscli agent link –host=cloud.tenable.com –port=443 –key=xxx
- When finished, start the Nessus Agent service for use (service nessusagent start). The service is configured to start automatically at system startup.
- The installed agent also provides a command line tool you can use to configure the agent’s settings, verify connectivity, and more. Open a command prompt and navigate the directory where the agent is installed.
- Run the ‘nessuscli’ command to show all available options (/opt/nessus_agent/sbin/nessuscli). The local agent commands allow you to configure the link settings, unlink the agent, and obtain the agent’s current status (/opt/nessus_agent/sbin/nessuscli agent status).
- Once you have installed and linked your agents to Tenable.io, they will begin communicating with Tenable.io.
- Navigate to your agent groups.
- Observe the number of agents in your group.
- You also have an option to delete the group.
- Click on the group and navigate to the “Manage Agents” section.
- Here, you can add or remove agents from the group. It is possible for an agent to be a member of multiple agent groups. For example, if you have a Windows web server, you may wish to place it in a general “Windows” group, as well as a group for “Servers”.
Deploy and Link PVS
Let’s demonstrate adding a PVS sensor to Tenable.io. Tenable.io can retrieve data gathered by the Passive Vulnerability Scanner. You can analyze this data similarly to data gathered from other sensors.
To get started, navigate to the “Scanners” Page.
- The Linking Key is the key that can link PVS sensors to Tenable.io. Copy it for later use when configuring PVS.
- After installing PVS on your desired platform, navigate to the PVS user interface.
- During the initial setup, provide the activation code “Cloud”. Cloud Host: cloud.tenable.com and Cloud Port: 443. In the “Cloud Key” field, paste the key that was copied earlier from Tenable.io.
- Provide a descriptive name. PVS now connects to Tenable.io and begins reporting results.
- If PVS is already installed and configured, you can change the settings by navigating to the “Configuration” page.
- Once the PVS connects to Tenable.io, you can verify connectivity by navigating to the “Scanners” page.
Create and Lunch Scans
Tenable.io makes it easy to gather data from your public-facing assets. Start by logging into your Tenable.io account and creating a new scan (Scans -> New Scan).
The best scan template for this type of scan is the “Basic Network Scan”. This template uses cloud-based scanners to identify known vulnerabilities over a common set of ports. It also identifies running services and extracts other information, all without using credentials.
- Enter a meaningful name, description, and destination folder.
- Next, choose the appropriate scanner.
- Choose target group that have already been defined and included a list of systems
- You can also enter IP addresses and hostnames, or upload a list.
- Next, set the scan to run once a day (Settings ->Basic -> Schedule -> Enabled -> Frequency).
- Because this scan identifies vulnerabilities on public-facing, easy to access targets, you may want to be notified of certain vulnerabilities. To do this, create a new email notification (Settings -> Basic -> Notifications -> Email Recipient(s) ).
- First, add the recipients.
- Then, create filters for “High” and “Critical” vulnerabilities.
- Result Filter: Match Any of the following:
- Severity is equal to High
- Severity is equal to Critical
- Next, give the other security analysts on your team “view-only” access to these scan results (Settings -> Basic -> Permissions). Although you can customize a variety of additional settings for this scan, the defaults are sufficient for most reliable networks.
- Save and lunch your scan.
iptables — the Linux Firewall
Some content on this page was disabled on August 22, 2018 as a result of a DMCA takedown notice from booleanworld.com. You can learn more about the DMCA here:
BeyondCorp
https://cloud.google.com/beyondcorp/
Today, none of Google’s employee-facing applications are on a virtual private network. They all have public IP addresses.
The company feels this approach, which it has dubbed BeyondCorp, is the “new cloud model,” for doing cloud security, asserted Neal Mueller, head of infrastructure product marketing at Google, who gave a presentation on this approach at the O’Reilly Security conference, held recently in New York.
This model can be fall under a number of rubrics in the security community, including “zero-trust” or “perimeter-less” security. It is the opposite of the traditional approach of security, which Mueller described as “the castle” approach, in which a strong firewall is used to set off an internal network that can only be accessed by way of a virtual private network (VPN).
The problem with the “castle” approach is that once the perimeter is breached, the entire internal network, and all the associated applications, are at risk. “Do not trust your network. It is probably already owned,” added Max Saltonstall, a Google program manager for corporate engineering, who also participated in the presentation. Phishing, man-in-the-middle, SQL Injection attacks all find fertile ground on VPNs.
Plus, a VPN was cumbersome to use, and slowed performance, especially for overseas workers. And it is no walk in the park for admins either. To set up a new user, the admin would typically have to configure the cloud network, along with setting up the IPSec rules and firewall rules, the VPN. This is followed by a lot of testing.
At Google, “we embraced the fact that walls don’t work,” Mueller said. “Rather than have a VPN around all this infrastructure, we decided to get rid of the walls entirely.”
Google’s approach involves comprehensive inventory management, one that keeps track of who owns which machine in the network. A Device Inventory Service collects a variety of live information about each device from multiple system management sources, such as Active Directory or Puppet.
Authentication is then based on a set of “Trust Tiers” represent levels of increasing sensitivity. Employees get the appropriate level of access regardless of what device they are using or where in the world they are logging in from. Lower levels of access require less stringent checks on the device itself.
“The access is granted based on context: Who are you? Have you authenticated in a strong way? What are you using? What do I know about your device?” Saltonstall summarized.
The network itself is unprivileged. For identity management, the company uses security keys, which are much harder to forge than passwords and are tied to the individual users themselves. Each work device has a certificate issued by Google. Encryption across the network is done through TLS (transport layer security), which is terminated at the access proxy.
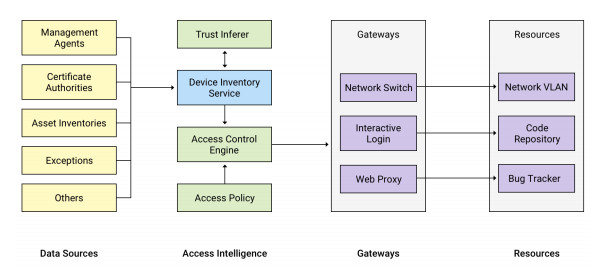
All the corporate resources are behind this uber-reverse proxy. Based on a decision provided by its “trust engine,” the proxy makes the decision of whether or not to provide access to the desired application. If permissions are in place, according to the tiered trust model, it forwards the requests to the application, along with the security credentials. The applications themselves are routinely checked for breaches by vulnerability scanners.
Amazingly, Google was able to shift all of its employees, including remotes ones, over to this new model, with minimal disruption, Saltonstall said.
To prepare for a transparent shift, which started in 2013, the migration team recorded all the actions that Google employees did on the old network, then rerun a simulation of the traffic on the new network. This monitoring gathered about 80TB a day (The model benefited the fact that all of Google’s internal applications are already on the Web).
“If you play back the current traffic on the new network, you can see what will break,” Saltonstall said. This lets the team identify those end-services that weren’t fully compliant yet, as well as identified users who could seamlessly switch over to the new network.
This approach has some good additional benefits, Saltonstall said. Provisioning Chromebooks for new employees is a minimal processing, taking no longer than 90 seconds worth of configuration settings.
With the “BeyondCorp” approach, “You are taking operation problems, and turning them into engineering problems, and then engineer them away,” Saltonstall said. “All the frustrating, boring human grunt-work becomes automated.”
Celery
Celery is an asynchronous task queue/job queue based on distributed message passing. It is focused on real-time operation, but supports scheduling as well.
The execution units, called tasks, are executed concurrently on a single or more worker servers using multiprocessing, Eventlet, or gevent. Tasks can execute asynchronously (in the background) or synchronously (wait until ready).
Celery is used in production systems to process millions of tasks a day.
GETTING STARTED
- Install celery by download or
pip install -U Celery - Set up RabbitMQ, Redis or one of the other supported brokers
- Select one of the following guides:
EASY TO INTEGRATE
Celery is easy to integrate with web frameworks, some of which even have integration packages.
Celery is written in Python, but the protocol can be implemented in any language. It can also operate with other languages using webhooks.
MULTI BROKER SUPPORT
The recommended message broker is RabbitMQ, but support for Redis, Beanstalk, MongoDB, CouchDB, and databases (using SQLAlchemy or the Django ORM) is also available.
Example Django project using Celery
https://github.com/celery/celery/tree/master/examples/django/
tcpick
This is EXAMPLES, produced by makeinfo version 4.7 from
EXAMPLES.texinfo.

1 Examples of tcpick usage
**************************

1.1 connection status
=====================

Tcpick is a sniffer able to understand wich status has the connection
(SYN-SENT, SYN-RECEIVED and so on). To see the connection tracker in
action on eth0 simply type:

     # tcpick -i eth0 -C

   `-C' means "enable colors", and the output is very pretty.

   You will see something like this:

     23:07:42.672171  1      SYN-SENT       12.34.56.78:41599 > 123.123.123.123:http
     23:07:42.822239  2      SYN-SENT       12.34.56.78:41600 > 32.13.21.32:5973
     23:07:42.826634  3      SYN-SENT       12.34.56.78:41601 > 123.45.67.89:5555
     23:07:42.854681  4      SYN-SENT       12.34.56.78:41602 > 1.2.3.4:56789
     23:07:43.084242  1      SYN-RECEIVED   12.34.56.78:41599 > 123.123.123.123:http
     23:07:43.087045  1      ESTABLISHED    12.34.56.78:41599 > 123.123.123.123:http
     23:07:44.061311  5      SYN-SENT       12.34.56.78:41603 > 10.20.30.40:8888

1.2 display the payload and packet headers
==========================================

It is very easy:

     # tcpick -i eth0 -C -yP -h -a

   `-yP' means "payload printable", `-h' means "header" and `-a' means
names resolution.  Unprintable carachters are displayed as dots.

1.3 display client data only of the first smtp connection
=========================================================

     # tcpick -i eth0 -C -bCU -T1 "port 25"

   `-bCU' means: display the rebuilded stream (`-b') only the client
side (`C') and unprintable carachters will be displayed as hexcode
(`U').

   `T1' means: display only the first (1) connection.

   "port 25" is the filter.

1.4 download a file passively
=============================

Yeah! It is very a simple job:

   #tcpick -i eth0 -wR "port ftp-data"

   When the file has been completely transmitted (connection displayed
as "CLOSED")  check in the working directory: you will find some files
named like this:

     # ls *.tcpick
     client_123.45.67.89_98.76.54.32_34567.tcpick
     server_123.45.67.89_98.76.54.32_34567.tcpick

   Bingo! If you do `$ file *.tcpick' you will find that one of the two
is a a gzip archive or whatever you sniffed.

1.5 redirect the first connection to a software
===============================================

You must choose between client or server side, because you don't want
both stream mixed in the standard output. It is a really simple job,
just type:

     # tcpick -i eth0 --pipe client "port 80" | gzip > http_response.gz
   or
     # tcpick -i eth0 --pipe server "port 25" | nc foobar.net 25

   Now, use your imagination and let me know what crazy experiments have
you done with tcpick ;^)
tcpdump
Basic syntax :
==============

Filtering hosts :
-----------------

- Match any traffic involving 192.168.1.1 as destination or source
# tcpdump -i eth1 host 192.168.1.1

- As soure only
# tcpdump -i eth1 src host 192.168.1.1

- As destination only
# tcpdump -i eth1 dst host 192.168.1.1


Filtering ports :
-----------------

- Match any traffic involving port 25 as source or destination
# tcpdump -i eth1 port 25

- Source
# tcpdump -i eth1 src port 25

- Destination
# tcpdump -i eth1 dst port 25


Network filtering :
-------------------

# tcpdump -i eth1 net 192.168
# tcpdump -i eth1 src net 192.168
# tcpdump -i eth1 dst net 192.168


Protocol filtering :
--------------------

# tcpdump -i eth1 arp
# tcpdump -i eth1 ip

# tcpdump -i eth1 tcp
# tcpdump -i eth1 udp
# tcpdump -i eth1 icmp


Let's combine expressions :
---------------------------

Negation    : ! or "not" (without the quotes)
Concatanate : && or "and"
Alternate   : || or "or"

- This rule will match any TCP traffic on port 80 (web) with 192.168.1.254 or 192.168.1.200 as destination host
# tcpdump -i eth1 '((tcp) and (port 80) and ((dst host 192.168.1.254) or (dst host 192.168.1.200)))'

- Will match any ICMP traffic involving the destination with physical/MAC address 00:01:02:03:04:05
# tcpdump -i eth1 '((icmp) and ((ether dst host 00:01:02:03:04:05)))'

- Will match any traffic for the destination network 192.168 except destination host 192.168.1.200
# tcpdump -i eth1 '((tcp) and ((dst net 192.168) and (not dst host 192.168.1.200)))'
So tcpdump doesn’t have a GRE pattern matches, but that doesn’t mean you can’t use ip[xx] to inspect things within gre. In a normal GREv0 packet: ip[36:4] is the source IP address, ip[40:4] is the destination and ip[33] is the protocol.
So, to match all TCP packets within a GRE header, write ‘tcpdump ip[33] = 0x06’, or to match anything sent from 127.0.0.1 within GRE, write ‘tcpdump ip[36:4] = 2130706433’ (or tcpdump ip[36] = 127 and ip[37] = 0 and ip[38] = 0 and ip[39] = 1).
Or, on the other hand, just use wireshark.
If you ever debugged network node with GRE you should know that painful feeling of tcpdump output. Thousands IPs and you can not differentiate them, because they are in GRE.
And there is no filters for IP addresses inside GRE. You can not say ‘tcpdump -ni eth0 proto gre and host 192.168.0.1’. Well, you can, but ‘host’ will be used only to filter source or destination of GRE packets, not the incapsulated IP packet.
Unfortunately there is no nice syntax. Fortunately, there is some, at least.
You’ll need to convert IP address to network-byte-ordered integer. For this every octet should be converted to hex and joined together ‘as is’. 100.64.6.7 will become 0x64400607.
For python: there is module ipaddress, but it’s not available in default installation. So we’ll do it manually with minimal code:
>> “0x%x%x%x%x” % tuple(map(int,’192.168.0.1′.split(‘.’)))
‘0xc0a801’
(sorry for mad code, but I wanted to keep it short).
Result of that code is ‘number’ representing IP address (in the example above – 192.168.0.1).
Now we can run tcpdump:
tcpdump -ni eth1 ‘proto gre and (ip[54:4]=0xc0a801 or ip[58:4]=0xc0a801)’
Numbers in the square brackets near ‘ip’ is offset and size of the field. IPv4 address is 4 bytes long. Because GRE add 42 bytes overhead (20 bytes first IP header, 8 bytes GRE header, 14 bytes encapsulated Ethernet header), we taking normal IP source/destination offset (see here) and adding it.
ip[36:4] is the source IP
ip[40:4] is the destination IP
We can verify the incoming traffic to see if they have VLAN tags by using tcpdump with the -e and vlan option.
This will show the details of the VLAN header:
# tcpdump -i bond0 -nn -e  vlan
To capture the issue live.
or
# tcpdump -i eno1 -nn -e  vlan -w /tmp/vlan.pcap
To write to the capture to a file.
If tcpdump is unable to filter any traffic, whereas running tcpdump unfiltered does show traffic, then the problem may be due to an extra Ethernet header being added, which is typically a VLAN header: 802.1Q VLAN. Use the tcpdump -e option to see this extra header information, which should look like the following:
. . . ethertype 802.1Q, length 64: vlan 128, p 0, ethertype IPv4,
IP 192.168.128.42.8001 > 192.168.128.90.20700:
Port Filtering
Trying to filter using tcpdump fails. An example is to filter on a known port number, such as the following:
tcpdump -ni eth2 port 8001If tcpdump is unable to provide a filtered output, then the passive capture software is not able to do so either.
If it is VLAN-type traffic, use the vlan expression operator as part of the filter expression:
tcpdump -ni eth2 vlan and port 8001Other examples of filtering with VLAN packets:
tcpdump -nr tst.dmp 'ether[12:2] = 0x8100'
tcpdump -nr tst.dmp vlan and ip and port 8001
To show both types of traffic:
tcpdump -nr tst.dmp ip or vlanHowTo – tell tcpdump to filter mixed tagged and untagged VLAN (IEEE 802.1Q) traffic
|
A week ago I needed to filter VLAN traffic with tcpdump. Everything went well, as long as *only* tagged or *only* untagged traffic was given as input. However, when trying to filter say UDP packets out of traffic that contains both tagged and untagged packets, tcpdump screwed my filters. As I think this situation may happen to some more people, here some input for nerds struggling with the same issue in the future. Example doomed to fail with mixed traffic:
tcpdump -nn -v udp This simple BPF filter should basically deliver all UDP packets, regardless whether the traffic is tagged with a VLAN tag or not. But: it doesn’t. The issue is that tagging traffic inserts four more bytes (namely the VLAN ID) to the ethernet (or more precisely IEEE 802.1Q) header. Without specifically asking for VLAN traffic in the BPF filter, every traffic is parsed as untagged traffic. Thus, the specified filter delivers only untagged UDP packets (i.e., their frames) and drops all tagged traffic. Now watch out: similar things happen if you specify the mysterious ‘vlan’ keyword in the tcpdump filter. After specifiying the ‘vlan’ keyword, the *subsequent* filters are matched against traffic shifted by 4 bytes to the right. Note that this is also true if you specify ‘not vlan’ as filter. The internals of how tcpdump translates the BPF filter are exposed when calling tcpdump with the -b option: BPF translation of filter ‘not vlan and udp’:
[root@vm-fedora ~]# tcpdump -nn -d not vlan and udp
(000) ldh      [12]
(001) jeq      #0x8100          jt 10   jf 2
(002) ldh      [16]
(003) jeq      #0x86dd          jt 4    jf 6
(004) ldb      [24]
(005) jeq      #0x11            jt 9    jf 10
(006) jeq      #0x800           jt 7    jf 10
(007) ldb      [27]
(008) jeq      #0x11            jt 9    jf 10
(009) ret      #96
(010) ret      #0
What do we see here? Although we explicitly specified to have untagged traffic, our filter fails and matches UDP traffic that has no VLAN tag but is shifter by 4 byte to the right (i.e., it matches nothing). Our fault was to specify the ‘vlan’ keyword, such that all preceding filters (‘udp’) are matched against shifted traffic. To cope with this issue, one should be careful in which order the filter is put together. If we want to match both tagged and untagged UDP traffic, we have to specify the following filter: Filter UDP traffic, both VLAN tagged and untagged:
[root@vm-fedora ~]# tcpdump -nn -d "udp or (vlan and udp)" Or, the generic solution: Generic filter expression that matches VLAN tagged and untagged traffic:
[root@vm-fedora ~]# tcpdump -nn -d "<filter> or (vlan and <filter>)" If you want to filter only untagged traffic, specify the following: Generic filter to match only untagged traffic:
[root@vm-fedora ~]# tcpdump -nn -d <filter> and not vlan Long story short: When using tcpdump (or libpcap), be careful where to put the ‘vlan’ keyword in your expression. In general, it’s a very bad idea to specify the keyword twice, unless you pack VLAN traffic into VLAN traffic. Maybe these examples are more explanative than the quote below taken from the tcpdump manpage: “Note that the first vlan keyword encountered in expression changes the decoding offsets for the remainder of expression on the assumption that the packet is a VLAN packet.” Recall this (admittedly sometimes strange) behavior is not a bug… Thanks goes to Nuno Paiva, who sent me an example how to solve matching mixed traffic. Thanks to Dan Cox who spotted missing quotes. Thanks to Max Lukoshkov for spotting a language issue (subsequent vs. preceding). |
tcpdump Flags:
TCP Flag tcpdump Flag Meaning SYN S Syn packet, a session establishment request. ACK A Ack packet, acknowledge sender’s data. FIN F Finish flag, indication of termination. RESET R Reset, indication of immediate abort of conn. PUSH P Push, immediate push of data from sender. URGENT U Urgent, takes precedence over other data. NONE A dot . Placeholder, usually used for ACK.
GitHub Porn Hosts
IP Location
Barnyard2
Barnyard2 is an open source interpreter for Snort unified2 binary output files. Its primary use is allowing Snort to write to disk in an efficient manner and leaving the task of parsing binary data into various formats to a separate process that will not cause Snort to miss network traffic.
Barnyard2 has 3 modes of operation:
 1. batch (or one-shot),
 2. continual, and
 3. continual w/ bookmark.
In batch (or one-shot) mode, barnyard2 will process the explicitly specified file(s) and exit.
In continual mode, barnyard2 will start with a location to look and a specified file pattern and continue to process new data (and new spool files) as they appear.
Continual mode w/ bookmarking will also use a checkpoint file (or waldo file in the snort world) to track where it is. In the event the barnyard2 process ends while a waldo file is in use, barnyard2 will resume processing at the last entry as listed in the waldo file.
The “-f”, “-w”, and “-o” options are used to determine which mode barnyard2 will run in. It is legal for both the “-f” and “-w” options to be used on the command line at the same time, however any data that exists in the waldo file will override the command line data from the “-f” and “-d” options. See the command directives section below for more detail.
Barnyard2 processing is controlled by two main types of directives: input processors and output plugins. The input processors read information in from a specific format ( currently the spo_unified2 output module of Snort ) and output them in one of several ways.
History
Barnyard is a critical tool for the parsing of Snort’s unified binary files, processing and on-forwarding to a variety of output plugins. Unfortunately it has not seen an updated in over 4 years and is not going to be maintained by the original developers. With the new version of the unified format (ie. unified2) arriving we need something to bridge this gap. To quote directly from the Snort FAQ:
- “Barnyard is an output system for Snort. Snort creates a special binary output format called unified. Barnyard reads this file, and then resends the data to a database backend. Unlike the database output plug-in, Barnyard is aware of a failure to send the alert to the database, and it stops sending alerts. It is also aware when the database can accept connections again and will start sending the alerts again.”
The SXL team love barnyard. So much so that we want it to stay and have been tinkering around with the code to give it a breath of new life. Here is what we have achieved to far for this reinvigorated code base: Parsing of the new unified2 log files.
- Maintaining majority of the command syntax of barnyard.
- Addressed all associated bug reports and feature requests arising since barnyard-0.2.0.
- Completely rewritten code based on the GPLv2 Snort making it entirely GPLv2.
